
You are struggling to enhance the shareability of your content and demonstrate expertise. Isn’t it?
On top of that you keep asking yourself, how do I make my own infographics.
I got you covered.
In today’s post, I’m here to give you the ultimate infographic guide that you have been waiting for but here’s the kicker: Over 15% of my audience read this creative infographic design ideas that are used in making an infographics.
Let’s get started.
The Ultimate Infographic Guide for 2024
What are Infographics?
According to Wikipedia, Infographics are graphical representation of data, information and knowledge intended to present information quickly and clear. Infographic uses a blend of images, text and graphics to breakdown complex information.
They can take many forms such as charts, maps, illustrations, timeline and graphs. Contnue reading to get the breakdown of this infographic guide.
Infographic Statistics

Over 55% of readers are more likely to accept messages in colour than in black and white.
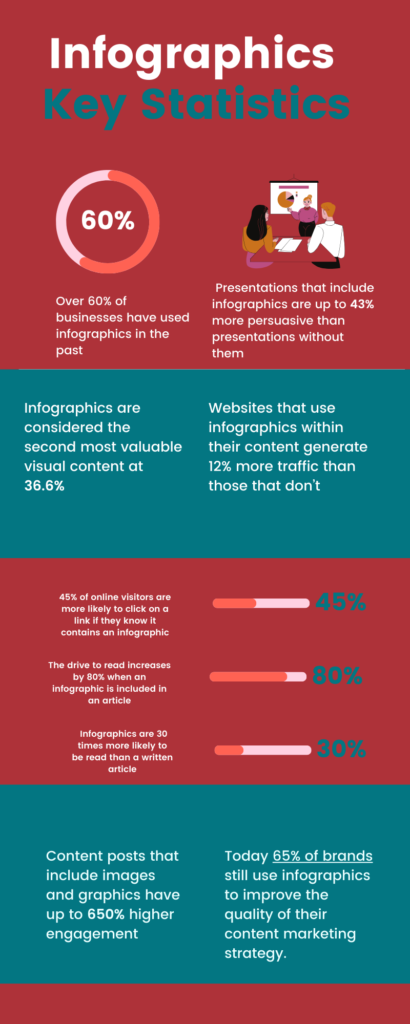
- Over 65% of businesses use infographics tp improve their content marketing strategy
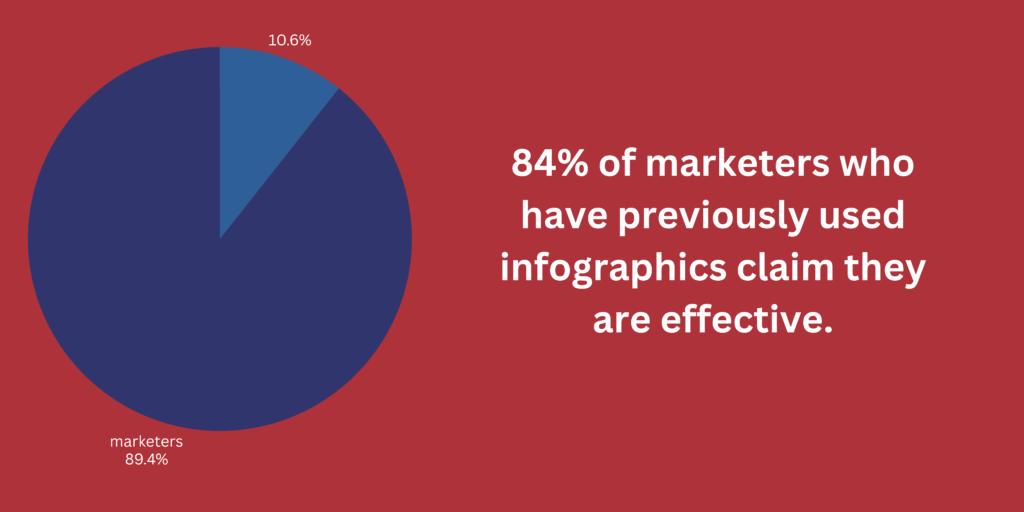
- 84% of marketers who have previously used infographics claim they are effective.
- A study by the Aberdeen Group revealed that organizations that use data visualization in their brand have 28% more chances of identifying important opportunities.
- Infographics are 30X more likely to be read than text based content
- The search volume of infographics on Google per month is about 246,000.
- About 65% of B2B content marketers use infographics in their content strategy.
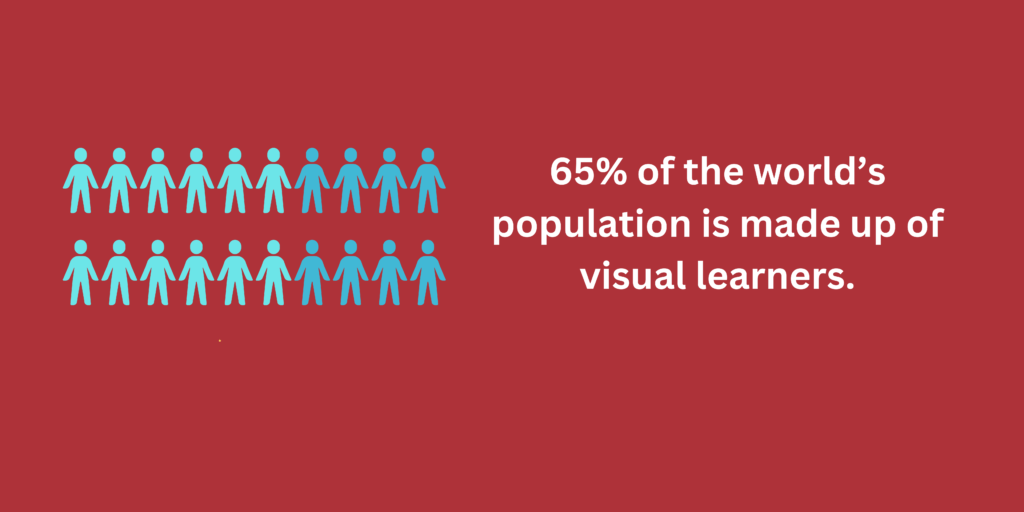
- 65% of the world’s population is made up of visual learners.
Best Infographic Design Tools
Question: What’s the fastest way to learn how to create infographics? Is there a free website or app that’s easy to use? Well, I have provided a list of the best infographics design tools right here.
The fact is that, this infographic guide woudn’t be complete without talking about the software invloved.
Let me confesss: Canva is my favorite.
Canva
Canva is one of the best free infographic software a graphic design tool that allows users to design a wide range of visual elements using a simple to use drag and drop builder. With Canva, you can create posters, presentations, documents, social media graphics, websites etc.
It has a user friendly interface and a good customer service awaiting you. Canva has a library of images, Illustrations and templates that you can use to easily customize your design at no extra cost to you.
However, you can easily create professional looking graphs with the best graphic design tool (Canva) without any advanced skills.
Visme
Visme helps in making an infographics with a drag and drop editor just like Canva. It’s used by over 27.5 million users and It offers a variety of resources that you can leverage to design your infographics, document, report, etc.
Hey, Visme is the visual communication platform for serious designers, period. It helps in designing visual contents that stand out such as data visualization.
The intuitive interface of Visme makes it a popular choice for businesses and individuals.
Venngage
Venngage is one of my favorite graphic design tools. It’s used by most graphic design agencies to make creative infographics. With venngage you can seamlessly transform your confusing communication and dull document into engaging infographics with no design skills.
It has stunning infographics templates that you can use to capture, engage and retain your audience. Start customizing your infographics without extensive design experience.
PicMonkey
PicMonkey is a company by shutterstock that is used for creating scroll stopping Instagram designs, design ey-catching flyers, infographics and creating invitation cards. Boost your engagement and win on X, Facebook, Instagram and LinkedIn with their stunning social media templates.
Picmonkey has 100s of gorgeous fonts, 1000s of templates and stock photos that you can leverage to reinforce your brand identity. It’s trusted by the world best brands including, Yelp, Dell, and Windermere.
Infograpia
Infograpia has over 4,500+ templates of infographics that is compatible with Google Slide, Power Point, and Keynote. Infograpia facilitate the creation of visually appealing graphics. The best part is that you also have the ability to download any template of your choice or customization.
Their infographics serve 165+ niche markets. Also, when you register you’ll receive a lifetime access to all the template on the platform. Infograpia is often regarded by many as the best software to create infographics.
Creative Infographic Design Ideas
Explore these 5 selected creative infographics design ideas to inspire your next project.
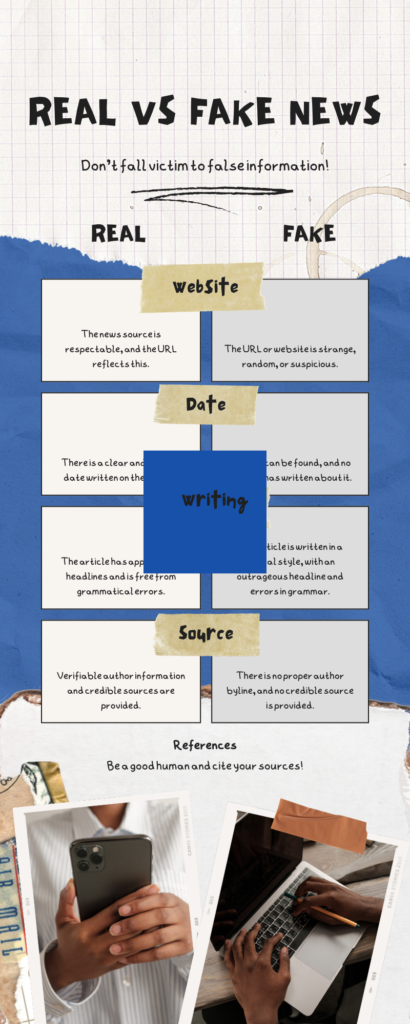
Comparison Infographics:
Comparison infographic uses similarities and differences to compare an item, product or service. This type of infographics uses colors and icons to visually represent and draw attention to key points. The use of comparison infographics help to prevent people form having trouble making up their minds. Try these comparison infographics ideas.
Key Benefits of Comparison Infographics
- Persuasion: By highlighting the strength and weakness of an item, you can simply influence the decision making process of your audience or prospects.
- Simplification: Comparison infographics helps to simplify complex data and eliminate the need for lengthy explanation.
- Visual Impact: Visual comparison are attention grabbing. By using colors, graphics and icons, you stand a good chance of appealing to a wider audience.
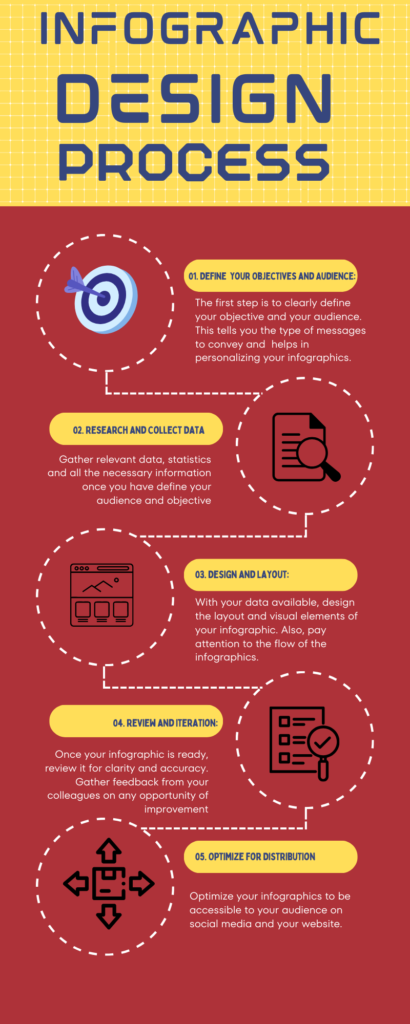
Process Infographics:
If you’ve been asking yourself: How do I create infographics? What software is the best and what tools do I need? This is for you.
Process infographic is a specific type of infographic that is used to breakdown complex workflows in to simple, easy to follow steps. You can use flowcharts, diagrams, or a numbered list to illustrate each stage of the process. Try these process infographics ideas
In addition, remember to incorporate arrows, icons and visual cues to guide your audience through the workflow.
Key Benefits of Process Infographics
- Memory Retention: When your audience see complex steps of a process simply visualized, they are more likely to remember it compared to reading a blurb of text.
- Simplicity: Process infographics reduce cognitive overload, making it easier for your audience to understand and retain any necessary information
- Training and Onboarding: Process infographics are important resources for training new employees. It helps to present the visual roadmap that they need to follow.
- Cross Department Communication: Process infographics enhances collaboration across multiple departments within an organization. This ensures that a common goal is achieved within an organization.
Statistical Infographics:
Statistical infographics as the name suggest is the process of presenting data and statistics visually using charts, graphics to visualize patterns and trends. This effectively communicate data and enhance readability. Try these statistics infographics.
Benefits of Statistical Infographics
- Education and Advocacy: Statistical Infographics are valuable educational resources for advocating for issues and raising awareness. This helps to convey important information to the public, stakeholders and policy makers.
- Decision Making: Statistical infographics help in decision making by presenting data in a way that is easy to interpret. It also helps in visualizing key performance indicators and metrics.
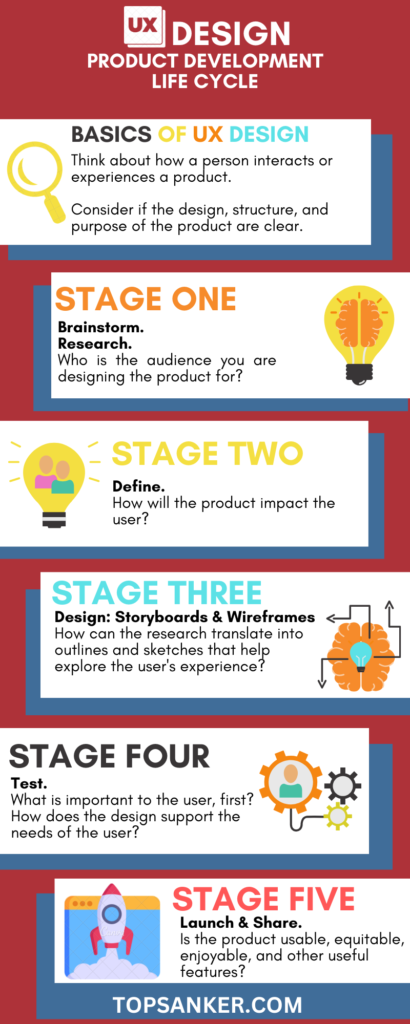
Storytelling Infographics:
Storytelling infographic is a type of infographic that is used to structure your infographics like a story by transforming data into narrative. When used properly, storytelling infographics capture the attention and influences behaviors. Try these storytelling infographic ideas.
Benefits of Storytelling Infographic Ideas
- Emotional Connection: Storytelling infographics evoke emotions and create deeper connections with your audience with visual stories. By incorporating personal stories and characters in your infographics, you stand a chance of appealing to your audience on an emotional level. This makes your information relatable.
- Persuasion: Storytelling infographics are persuasive tools for influencing opinions. When this infographics are properly design, viewers see things from a unique perspective.
Timeline Infographics:
Timeline infographics are visual representation of events arranged chronologically. These infographics displays informations in a timely progress format. Try these timeline infographic ideas.
Benefits of Timeline Infographics
- Project Management: Timeline infographics assists in project management, design, and planning. Look, by visualizing milestones, deadlines and timelines, teams stay organize and keep track of proceeding faster.
- Organization: Timeline infographics helps to organize information in logical structure. This makes it easy for organizations and teams to navigate the information presented.
Factors to Consider When Choosing Graphic Design Agencies
So you want to make your brand memorable but falling in the hands of the wrong agency. Well, if you don’t follow these 5 factors to consider when choosing a graphic design firm, you’ll continue to have glitches in your design.
Client Reviews and Testimonials
Check for client reviews and testimonials of any graphic design agency you’re considering. Positive feedback gives you the assurance that the agency is trusted. However, check for negative feedbacks as well.
Experience and Expertise
Its important to know whether or not the agency you want to contract has worked on projects similar to yours. Also, access the agencies experience in making an infographics and handling multiple graphic design tools.
Portfolio and style
Review and take note of the company’s portfolio to access the style of their work. Check whether their style is relevant to your project.
Creativity and Innovation
Contract a graphic design agency that demonstrate abnormal level of creativity and innovation in their design. Do they have fresh ideas and perspectives?
Turnaround Time
Consider the workload of the infographic design agency. This ensures that they meet the deadline of your projects. Its advisable to have discussions about turnaround time before outsourcing your project.
Technical Skills and Tools
Get to know the agencies technical know how and the tools they use in their design process.
Tried and Tested Graphic Design Courses Online
There are a lot of graphic design courses online that aligns with your educational goals. Hey, if you want to refine your design skills, you need fundamental principles such as color theory, typography and layout techniques to get started.
Choose any of these carefully selected platforms to enhance your graphic design skills today.
Coursera
Coursera was founded in 2012 by Stanford University professors, Depline Koller and Andrew Ng. Coursera offers certificate and degree in variety of subjects including graphic design and branding.
Pros
- Good teachers and practical assignment
- Students may take courses organized by well known companies.
- Best University courses are available.
Cons
- Certificate fess are a bit higher
- User interface can be improved
Udemy
Udemy is an online and teaching platform that was founded in May 2010 by Eren Bali, Oktay Caglar and Gagan Byani. It has over 213,000 courses including graphic design and 62 million students. With Udemy, you can seamlessly master graphic design at your own pace.
If you want to build unique user experience in application development and product packaging, Udemy is the elearning platform that you can trust.
Pros
- Course are affordable as compare to other platforms
- Shares where you can deepen your knowledge
- The platform is very easy to use
Cons
The category grouping could be refine.
Alison
Alison was founded by Irish social entrepreneur, Mike Feeric on April 2007 in Germany. It’s one of the world largest e-learning platforms that you can trust for education and graphic design skills. Join over 8 million graduates and empower your skills now.
Maximize your graphic design potential and advance your career to stand out in your field with Alison.
Open Labs Ghana
If you want to develop your problem solving skills in graphic design so that you can have an upper-hand in branding and infographic design, Open Labs Ghana is one of the best graphic design course platform on the internet.
With Open Labs Ghana, you should be able to convey your thoughts and ideas with visuals elements. Embrace your problem solving skills and practicality. If you want to become creative director, multi media artist, brand identity designer, Open Labs Ghana is the perfect place to be.
Benefits of Outsourcing to Infographic Design Agency
Diverse Expertise: Graphic design agencies often have a team of highly skilled professionals including branding and marketing personnels, making an infographic design seamless. The diverse expertise of these graphic design teams ensures the success of your projects.
- Creativity and Innovation: The best graphic design teams thrive on creativity and innovation. Their team is made of visual intelligence that you may not see in house.
- Access to Resources: Graphic design agencies have a lot of resources and tools such as Canva, Adobe Illustrator and alot of industry connections.
- High Quality Design: Graphic design agencies often hire the best designers in the industry so working with them will surely yield relevant design that to makes your project to standout.
- Timely Delivery: Top graphic design agencies can deliver quality results with fast turnaround. This ensures timely completion of your project.
Infographic Design Companies
League Design Agency
League design Agency was founded in 2017 by a designer and a business man. The agency has grown into over 40 workers and has won 28 awards in total. League of Design has over 120 clients from 25 countries.
This is a trustworthy graphic design agency made up of engineers with digital design on top of mind. With 109 Clutch reviews, you can expert nothing but an excellent result from a proven team. Their design service solves functional problems and and are aesthetically pleasing to their customers.
DD.NYC
DD.NYC is a creative and reliable graphic design agency with 79 reviews on Clutch at the time of publishing this post. They are experts at infographic design and designing brand identity. You can trust the experts and the process of DD.NYC.
Their service include branding, infographic design, packaging. The team at DD.NYC creates world class design using best practices while maintaining bespoke originality.
They have a long lasting relationship with 250+ clients and 50+ multi disciplinary team of creative technologists making an infographic design simple for them.
Polar
Polar is an award winning graphic design firm that turns your brand vision into something tangible. They have won multiple awards including 2022 best creative agency – UK , Agency Awards, 2023 Best Creative Agency – UK Agency Awards.
They deliver services that leave a lasting impression and encourages your prospects to take action. When you partner with Polar, you’ll have the chances of making impressive journey for your customers.
Bold Brand Agency
Bold Brand Agency is an experienced team of branding experts that helps you to solve your design glitches. Bold Brand Agency collaborates with creative designers to develop concepts and ensures that your project meets brand standard.
Bold Design Agency has a team of professionals that focus on design that delivers rather than labels that look good. In fact, they’ve won over 17 awards.
ThompsonStenning
Thompson Stenning is a top level design agency that is focus on producing branding and marketing materials at scale to spark your brand identity, to reinforce your brand and market it great again.
Thompson has been working with globally recognised agencies such as World Bank Group, Interpeace, Women in Film and Television Atlantic etc.
Infographics Marketing Tactics
These are the 4 main infographics marketing tactics that are working for me right now.
Optimize for social sharing
To give your infographics the maximum chances to perform on social media, you should have social sharing in mind. Just create visually appealing graphics that are properly optimized for social media platforms by including social share button.
This enables your audience to share your graphics with their network. This simple Hack increases brand awareness.
Include Branding Elements
If you want to reinforce your brand recognition, incorporating elements such as logo, colors and any relevant visual element.
However, its advisable not to make your infographics overly promotional.
Focus on Visual Storytelling
Infographics are visual storytelling resources so focus on designing them to capture your audience attention. Use data, text, visual to effectively convey your message.
In fact, this infographic marketing tactics is my favorite.
Track and Analyze Performance
Use analytics tool to track the performance of your infographics. Track key metrics such as views, shares and engagement.
Utilize Infographic Directories
Share your infographics on infographics directories such as Pinterest and Archives to boost their reach
Provide Actionable Insights
Offer valuable tips and any actionable insights to position you as a helpful resource to your audience.
Final Though – Infographic Guide
I have covered a lot in this infographic guide. Infographic helps to convey complex information in a visually compelling manner.
My only question is, what’s your favorite infographic design tool?
Let me know in the comment section.
Frequently Asked Questions on Infographics
How do you create infographics? What software is best and what tools do you need?
Creating infographics involves many steps. In addition, there are a lot of infographic design tools available to seamlessly handle the process.
The steps involved are:
- Define your objective
- Gather data and content
- Choose a software tool:
- Canva
- Visme
- Piktochart
- Adobe Illustrator
- Adobe Photoshop
4. Add visual elements
5. Review and revise
6. Optimize for distribution
Where can I find a great infographic designer?
You can perform your search for an infographic designer on multiple platforms, including:
- Freelance Platforms: platforms like Upwork and Freelancer have a vast pool of professional infographic designers. You can browse through their portfolio and client review so that you can find a creative designer that matches your budget and requirements.
- Infographic Design Agencies: You can simply discover a design agency that fits your requirements with a Google search or by asking a colleague for a recommendation.
- Social Media: Platforms such as LinkedIn, X and Dribble are few of the great places to find a reliable infographic designer
What are the Best Tools for Creating Video Infographics?
Creating video infographics is a great way to stand out with your content. Let me introduce you to the top 10 tools for creating video infographics.
- Canva
- Wideo
- Lumen5
- BeeCut
- LightMV
- Biteable
- Animaker
- Adobe Express
- Mango Animate
- MiniTool MovieMaker
What websites can you submit infographics to?
If you have designed an infographic for the workflow of your business or any other purpose, chances are you might consider distributing it to reach a wider audience. Discover these trustworthy infographic submission sites
- Slideshare
- Behance
- Flickr
What are the uses of inflographics?
Infographics serve various purposes in different sectors due to their visual appeal. Some of the uses of infographics include:
- Explaining Concepts: Infographics help break down complex concepts into visual elements. This makes it super easy to convey your message.
- Educational Purpose: Infographics make learning easy and enjoyable for students when information is presented in a concise manner.
- Data Visualization: Infographics are effective way to visualize data and statistics. Charts and graphs help to illustrate patterns and trends.
How do infographics influence SEO?
Infographics positively impact SEO by attracting quality backlinks, improving the user experience and increasing social shares. However, you need to create high quality infographics and adhere to SEO best practices to get the best results.
How much do infographics cost to make?
The price of an infographic design can range from $100 for a simple design to over $1,000 for a custom project. The price also depends on the expertise of the designer.
How do I use infographics to drive website traffic?
There are several strategies that you can adopt to drive website traffic with infographics. 3 of the best strategies are:
Optimize for SEO: Optimize your infographics by including relevant keywords in the alt text and title tag to rank highly in Google searches.
Promote on Social Media: Use relevant hastags and share your infographics on platforms such as X, Instagram, Facebook, and LinkedIn to attract a lot of traffic to your website.
Submit to Infographic Directories: Submit your infographics to directories so that you can reach a wider audience and drive traffic back to your site. It’s as simple as that.
What is the difference between a graphic and an infographic?
Graphics are visual representations such as images, logos, and icons, while infographics are visuals that combine text, graphics, and data to convey complex information.